

Stat Calcs
To download: Right-click on the file, then select 'Save Target As...' | Professor K. Krishnamoorthy [Dept of Mathematics, UL Lafayette, Lafayette, Louisiana, USA] |
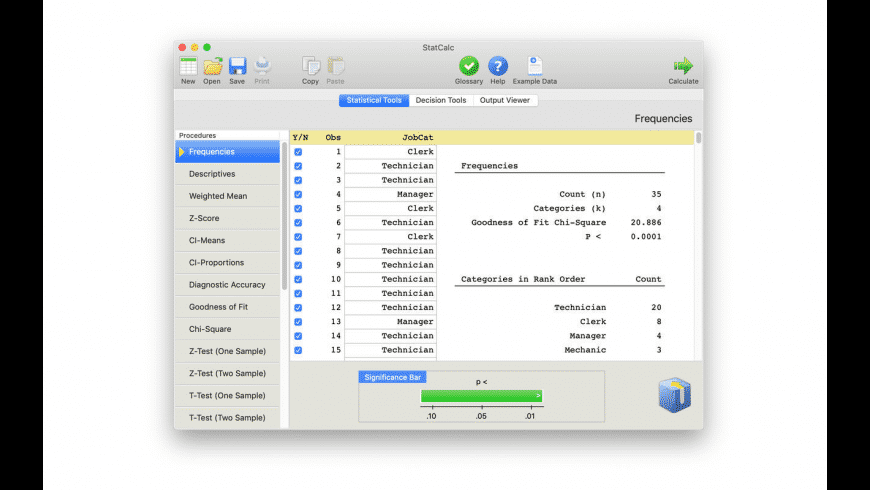
StatCalc 2.0 StatCalc 3.0 (08/14/2014) | Description:StatCalcis a PC calculator that computes table values of many commonly used statistical distributions. It also computes moments, and many other statistics; see the table of content. Download and click on setup.exe. StatCalc also comes with help files. Operating Systems: Windows 7, XP, 2000; Windows 8. Disk space :10 MB. Right click the link on the left, and select “save target as.” Click on setup.exe. Admin privileges is not required to install the software. In case you encounter any installation problems,download StatCalc.zip, and extract the files in the same directory. |
Fortran Programs... Comments to krishna@louisiana.edu | |
1. Noncentral t | Fortran program to evaluate the cdf of the noncentral t [Benton, D. and Krishnamoorthy, K. (2003). Computing discrete mixtures of continuous distributions: noncentralchisquare, noncentral t and the distribution of the square of the sample multiple correlation coefficient. Computational Statistics and Data Analysis, 43, 249-267] |
2. Noncentral chi-square | Fortran program to evaluate the cdf of the noncentral chi-square [ Benton, D. and Krishnamoorthy, K. (2003)] |
3. Two Proportions | Fortran program: computes the p-value for testing the difference between proportions from two finite populations. [Krishnamoorthy, K. and Thomson, J. (2002). Hypothesis testing about proportions in two finite populations. The American Statistician, 56, (2002), 215-222.] |
4. Power : Two Proportions | Fortran program: computes the power of the test (3) for the difference between proportions from two finite populations. [Krishnamoorthy, K. and Thomson, J. (2002)] |
5. Two Poisson Means | Fortran program: computes the p-value for testing the difference between two Poisson means. [Source: Krishnamoorthy, K and Thomson, J. (2004) A more powerful test for comparing two Poisson means. Journal of Statistical Planning and Inference, 119, 249-267] |
6. Power: Two Poisson Means | Fortran program: computes the power of the unconditional test for the difference between two Poisson means. [Krishnamoorthy, K and Thomson, J. (2004) A more powerful test for comparing two Poisson means. Journal of Statistical Planning and Inference, 119, 249-267] |
7. Lognormal mean | Fortran program: computes confidence limits for the mean of a lognormal distribution. [Krishnamoorthy, K. and Mathew, T. (2003) Inferences on the means of lognormal distributions using generalized p-values and generalized confidence intervals. Journal of Statistical Planning and Inference, (2003), 115, 103 – 121] Help7.pdf |
Computes the power of the test in (7). For a given mean and standard deviation of the logged data, and the sample size, this program computes the power of the test in (7). Help8.pdf | |
Computes the p-value for testing the difference between two lognormal means. Also, computes the confidence interval for the difference between the means. Help9.pdf | |
Computes the power of the test (9) for testing the difference between two lognormal means. Help10.pdf | |
11. One-sided limits for exceedance probabilities SAS code | Computes the one-sided limits for the exceedance probabilities assuming random effects model. See Krishnamoorthy, K. Mathew, T.and Ramachandran, G. (2007). Upper limits for the exceedance probabilities in one-way random effects model.Annalsof Occupational Hygiene, 51, 397-406. |
12. R programEXPOSURE_MDLS.r; help file | Krishnamoorthy, K. and Zhao Zu (2011). Confidence Limits for Lognormal Percentiles and for Lognormal Mean based on Samples with Multiple Detection Limits. Annals of Occupational Hygiene, 55,495-509. Krishnamoorthy, K., Mathew, T. and Xu, Z.(2014). Standardized likelihood inference for the mean and percentiles of a lognormal distribution based on samples with multiple detection limits. Journal of Environmental Statistics, 6, 1–18. |
13. GammaInfer.r | This R program computes confidence intervals for gamma parameters and mean, CIs for the difference between two means, difference between two shape parameters. Also, calculates the p-values for testing the mean and parameters, comparing two means, two scale parameters and for comparing two shape parameters. Krishnamoorthy, K. and Luis, N. (2014).Small sample inference for gamma distributions: one- and two-sample problems.Environmetrics, 25, 107-126. |
| You are visitor! ... since March 3, 2001 |

Stat Calculations

Stat Calculator Pathfinder
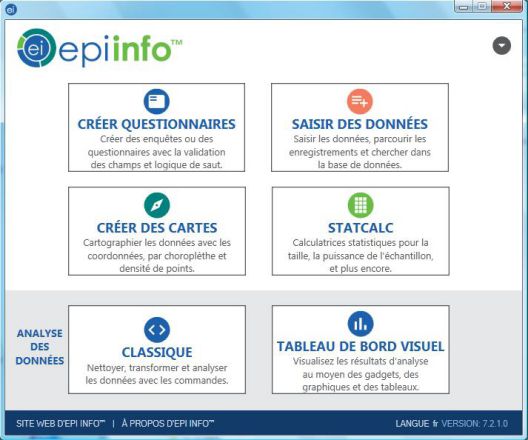
Use the data in BD1.REC to determine if there is a dose-response relationship between alcohol (variable ALC) and esophageal cancer (variable ESOPHCA). Data are cross-tabulated with ANALYSIS and tested with STATCALC. Epi Info is a free software package developed by the United States of America Centers for Disease Control which allows users to: check the survey data for outliers and inconsistent data. Conduct a descriptive analysis of survey data. Easily generate output files from the analysis.
